
This post is going to explore SHAP values. SHAP stands for SHapley Additive exPlanations and is a way of explaining the output of a machine learning model.
Table of Contents
import numpy as np
import pandas as pd
import shap
import xgboost
from sklearn.datasets import fetch_california_housing
from sklearn.model_selection import train_test_split
shap.initjs()

Load the Data
We’ll download the California housing dataset.
It contains the following features:
- MedInc - median income in block group
- HouseAge - median house age in block group
- AveRooms - average number of rooms per household
- AveBedrms - average number of bedrooms per household
- Population - block group population
- AveOccup - average number of household members
- Latitude - block group latitude
- Longitude - block group longitude
The target variable is the median house value in units of hundreds of thousands of dollars.
california_data = fetch_california_housing()
X = california_data["data"]
y = california_data["target"]
We’ll rewrite the feature names so they’re easier to understand.
feature_names = [
    "Median income",
    "Median age",
    "Avg number of rooms",
    "Avg number of bedrooms",
    "Block population",
    "Avg number of occupants",
    "Latitude",
    "Longitude",
]
Now let’s split the data.
X_train, X_test, y_train, y_test = train_test_split(X, y, test_size=0.2, random_state=42)

X_train = pd.DataFrame(X_train, columns=feature_names)
X_test = pd.DataFrame(X_test, columns=feature_names)
Train a Model
Now let’s train a model. Any machine learning model would work, but in this case we’ll use xgboost.
model = xgboost.XGBRegressor(random_state=42)
model.fit(X_train, y_train)
XGBRegressor(base_score=0.5, booster='gbtree', callbacks=None,
             colsample_bylevel=1, colsample_bynode=1, colsample_bytree=1,
             early_stopping_rounds=None, enable_categorical=False,
             eval_metric=None, gamma=0, gpu_id=-1, grow_policy='depthwise',
             importance_type=None, interaction_constraints='',
             learning_rate=0.300000012, max_bin=256, max_cat_to_onehot=4,
             max_delta_step=0, max_depth=6, max_leaves=0, min_child_weight=1,
             missing=nan, monotone_constraints='()', n_estimators=100, n_jobs=0,
             num_parallel_tree=1, predictor='auto', random_state=42,
             reg_alpha=0, reg_lambda=1, ...)
Find the SHAP Values
The first step is to create a shap explainer. In this case, we’ll use shap.TreeExplainer. All we have to do is pass our model to it.
explainer = shap.TreeExplainer(model)
Once we have an explainer, we can either pass a single example to it or the entire dataset. Let’s start with the entire dataset so we get a feel for the model.
shap_values = explainer.shap_values(X_test)
ntree_limit is deprecated, use `iteration_range` or model slicing instead.
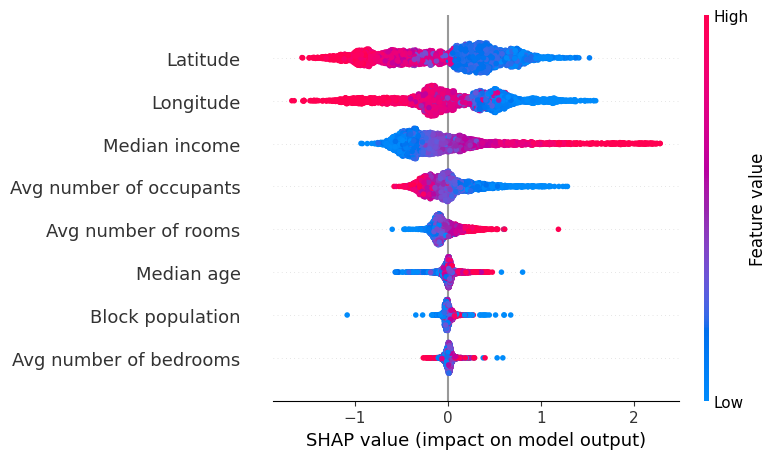
Now we can visualize the model.
shap.summary_plot(shap_values, X_test)
No data for colormapping provided via 'c'. Parameters 'vmin', 'vmax' will be ignored
We can also look at specific examples and understand their results.
def shap_example(index):
    example = X_test.iloc[index].values
    example = example.reshape(1, -1)  # Reshape example into 2d matrix
    shap_values = explainer.shap_values(example)

    return shap_values, example
shap_values, example = shap_example(15)
shap.force_plot(explainer.expected_value, shap_values, example, feature_names=feature_names)
Have you run `initjs()` in this notebook? If this notebook was from another user you must also trust this notebook (File -> Trust notebook). If you are viewing this notebook on github the Javascript has been stripped for security. If you are using JupyterLab this error is because a JupyterLab extension has not yet been written.
Let’s do another example.
shap_values, example = shap_example(41)
shap.force_plot(explainer.expected_value, shap_values, example, feature_names=feature_names)
Have you run `initjs()` in this notebook? If this notebook was from another user you must also trust this notebook (File -> Trust notebook). If you are viewing this notebook on github the Javascript has been stripped for security. If you are using JupyterLab this error is because a JupyterLab extension has not yet been written.
Dropping a Feature
Let’s say we don’t want to use some features. In this example, let’s say we don’t want to use location data. We can simply drop that from the dataset and rerun everything.
X_train = X_train.drop(columns=["Latitude", "Longitude"])
X_test = X_test.drop(columns=["Latitude", "Longitude"])
Now we have to update the feature names.
feature_names = [
    "Median income",
    "Median age",
    "Avg number of rooms",
    "Avg number of bedrooms",
    "Block population",
    "Avg number of occupants",
]
Let’s build a new model.
model = xgboost.XGBRegressor(random_state=42)
model.fit(X_train, y_train)
XGBRegressor(base_score=0.5, booster='gbtree', callbacks=None,
             colsample_bylevel=1, colsample_bynode=1, colsample_bytree=1,
             early_stopping_rounds=None, enable_categorical=False,
             eval_metric=None, gamma=0, gpu_id=-1, grow_policy='depthwise',
             importance_type=None, interaction_constraints='',
             learning_rate=0.300000012, max_bin=256, max_cat_to_onehot=4,
             max_delta_step=0, max_depth=6, max_leaves=0, min_child_weight=1,
             missing=nan, monotone_constraints='()', n_estimators=100, n_jobs=0,
             num_parallel_tree=1, predictor='auto', random_state=42,
             reg_alpha=0, reg_lambda=1, ...)
explainer = shap.TreeExplainer(model)
shap_values = explainer.shap_values(X_test)
ntree_limit is deprecated, use `iteration_range` or model slicing instead.
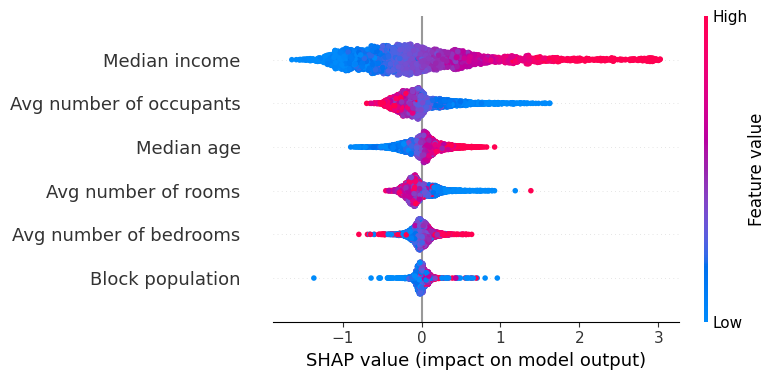
shap.summary_plot(shap_values, X_test)
No data for colormapping provided via 'c'. Parameters 'vmin', 'vmax' will be ignored
Let’s look at an example.
shap_values, example = shap_example(1)
shap.force_plot(explainer.expected_value, shap_values, example, feature_names=feature_names)
Have you run `initjs()` in this notebook? If this notebook was from another user you must also trust this notebook (File -> Trust notebook). If you are viewing this notebook on github the Javascript has been stripped for security. If you are using JupyterLab this error is because a JupyterLab extension has not yet been written.
They’re so pretty. Let’s look at some more.
shap_values, example = shap_example(2)
shap.force_plot(explainer.expected_value, shap_values, example, feature_names=feature_names)
Have you run `initjs()` in this notebook? If this notebook was from another user you must also trust this notebook (File -> Trust notebook). If you are viewing this notebook on github the Javascript has been stripped for security. If you are using JupyterLab this error is because a JupyterLab extension has not yet been written.
shap_values, example = shap_example(5)
shap.force_plot(explainer.expected_value, shap_values, example, feature_names=feature_names)
Have you run `initjs()` in this notebook? If this notebook was from another user you must also trust this notebook (File -> Trust notebook). If you are viewing this notebook on github the Javascript has been stripped for security. If you are using JupyterLab this error is because a JupyterLab extension has not yet been written.
shap_values, example = shap_example(9)
shap.force_plot(explainer.expected_value, shap_values, example, feature_names=feature_names)
Have you run `initjs()` in this notebook? If this notebook was from another user you must also trust this notebook (File -> Trust notebook). If you are viewing this notebook on github the Javascript has been stripped for security. If you are using JupyterLab this error is because a JupyterLab extension has not yet been written.
shap_values, example = shap_example(11)
shap.force_plot(explainer.expected_value, shap_values, example, feature_names=feature_names)
Have you run `initjs()` in this notebook? If this notebook was from another user you must also trust this notebook (File -> Trust notebook). If you are viewing this notebook on github the Javascript has been stripped for security. If you are using JupyterLab this error is because a JupyterLab extension has not yet been written.
shap_values, example = shap_example(41)
shap.force_plot(explainer.expected_value, shap_values, example, feature_names=feature_names)
Have you run `initjs()` in this notebook? If this notebook was from another user you must also trust this notebook (File -> Trust notebook). If you are viewing this notebook on github the Javascript has been stripped for security. If you are using JupyterLab this error is because a JupyterLab extension has not yet been written.
SHAP values are great for explaining models. There’s even more that you can do with them that I haven’t explored here.