
Neural Tangent Kernels (NTKs) are an exciting topic in the field of machine learning that combine aspects of neural networks and kernel methods.
Neural Tangent Kernels, introduced by Arthur Jacot et al. in 2018, provide an interesting perspective on training deep neural networks. The Neural Tangent Kernel is a method that allows us to approximate the behavior of a neural network with a kernel method. In simpler words, NTKs provide a kernelized view of neural networks, which has led to better insights into their training dynamics and generalization abilities.
The central idea of the NTK framework is to view the training process of a neural network as a kernel regression problem. The Neural Tangent Kernel is a positive definite kernel that evolves with the parameters of the neural network during training. NTKs play a significant role in simplifying the study of infinitely wide neural networks, as they allow these networks to be analyzed using the tools of kernel methods.
The NTK is called ‘tangent’ because it is essentially the dot product of the gradients of the network function (with respect to the network weights) evaluated at two different inputs. These gradients represent the directions in which the network function can change, hence the term ‘tangent.’
The most important result from the NTK framework is that as the width of the neural network goes to infinity, the learning dynamics of the network simplify. Specifically, for any neural network, the parameters evolve as if the network was trained under a linear model defined by the NTK.
Now let’s code one up.
import matplotlib.pyplot as plt
import numpy as np
import torch
import torch.nn as nn
torch.manual_seed(0);
Now let’s create a model.
class Net(nn.Module):
    def __init__(self, input_dim, hidden_dim, output_dim):
        "Define the model: a simple two-layer net."
        super().__init__()
        self.lin1 = nn.Linear(input_dim, hidden_dim)
        self.lin2 = nn.Linear(hidden_dim, output_dim)

    def forward(self, x):
        h = torch.relu(self.lin1(x))
        return self.lin2(h)
input_dim = 20

model = Net(input_dim, 10, 1)
Let’s generate some sample input data.
num_data = 100
x = torch.randn(num_data, input_dim)
Now we can compute the NTK.
def get_grads(model, x):
    # Get gradients for all data points
    grads = []
    for xi in x:
        model.zero_grad()
        out = model(xi.unsqueeze(0))  # add an extra dimension to xi
        out.backward()
        grads.append(torch.cat([p.grad.view(-1) for p in model.parameters() if p.grad is not None]))
    return grads


def compute_ntk(model, x):
    grads = get_grads(model, x)
    num_data = len(x)
    ntk = torch.zeros((num_data, num_data))
    for i in range(num_data):
        for j in range(i, num_data):
            ntk[i, j] = torch.dot(grads[i], grads[j])
            ntk[j, i] = ntk[i, j]  # use symmetry to halve computations
    return ntk
ntk = compute_ntk(model, x)
plt.imshow(ntk, cmap="hot")
plt.title("Neural Tangent Kernel")
plt.colorbar()
plt.show()
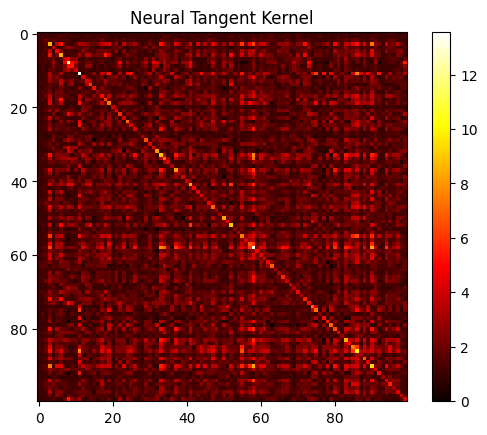
Here we’re looking at a heat map representation of the NTK. This matrix is computed as the dot product of gradients of the network outputs with respect to the parameters for every pair of data points in the batch. You can see how the data points relate to one another. In this case, the data were random, so there’s not that much to display.
If a cell in the matrix has a high value, it indicates that the corresponding pair of data points have similar gradients (i.e. changing the network’s weights will have a similar effect on both these outputs).
The diagonal of the matrix corresponds to the dot product of a gradient with itself, which is essentially the squared norm of the gradient. This means the diagonal elements will be ‘hotter’ if the magnitude of the gradients is large, suggesting that the network’s output is very sensitive to changes in weights for that particular input.
The visualization can be helpful in understanding the relationships between different data points in your dataset from the perspective of your model. For example, clusters of ‘hot’ cells might indicate groups of data points that the network perceives as being similar (i.e., they belong to the same class or have similar features).